
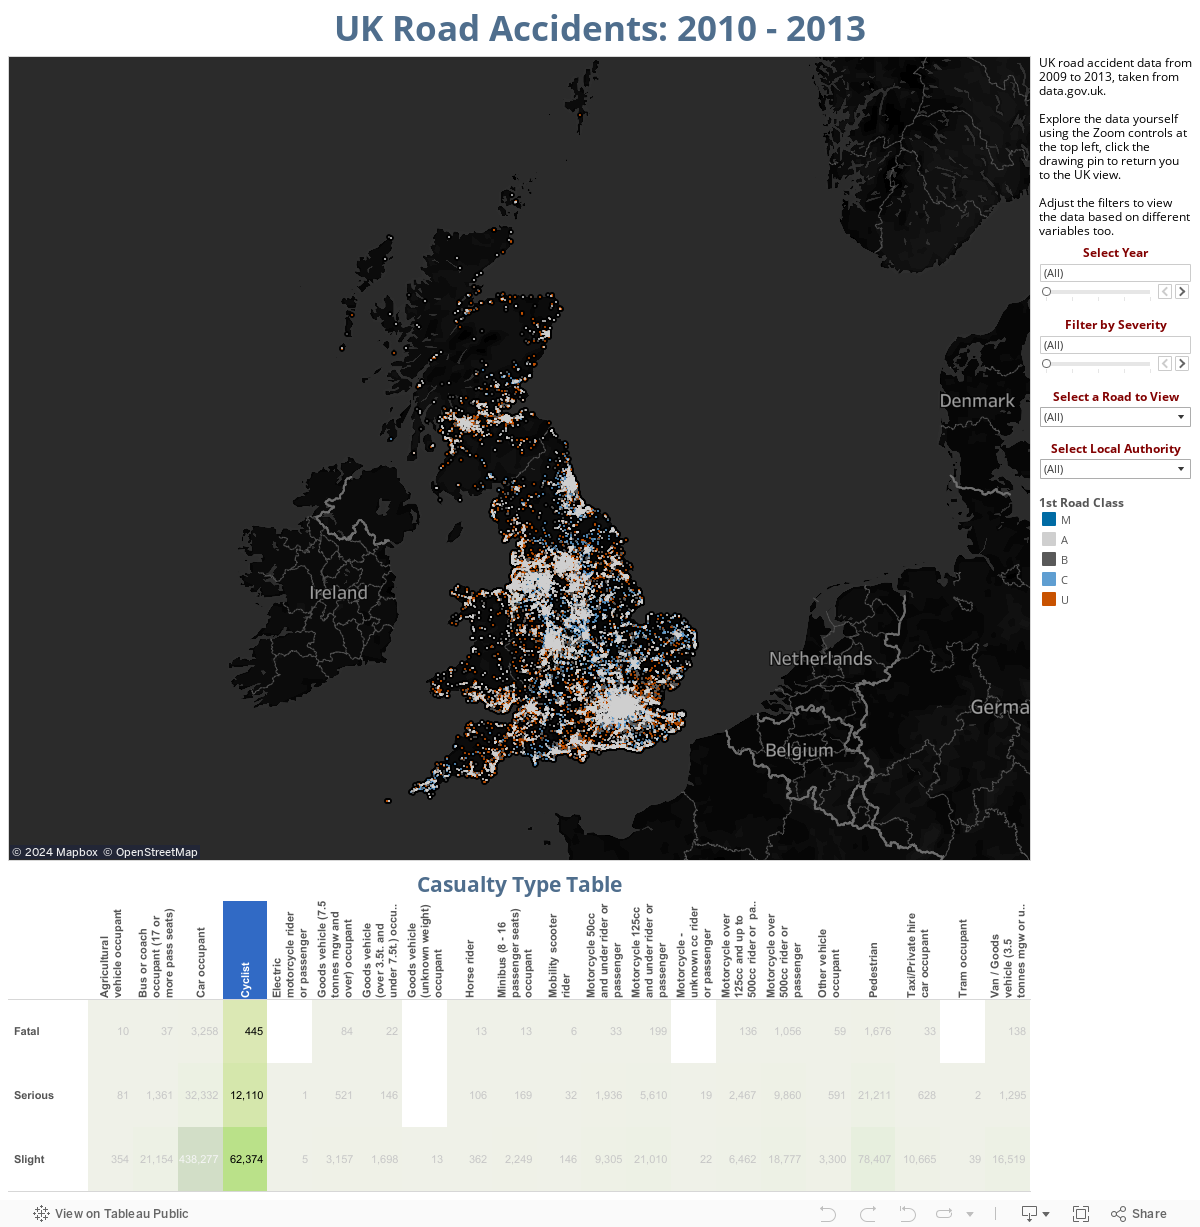
This time though we can understand how many casualties fell into each severity, as well as looking at the different types of casualties (e.g. Cyclists, Horse riders, Pedestrians etc.). The table at the bottom is interactive, so will filter the map if you click - note that each square is clickable so you can go in to quite a lot of detail there.
In addition I've added a couple of new filters on the right-side bar. The first one came to me as I was on a conference call with a supplier who'd just had a road accident that morning and showed remarkable dedication in showing up to the call still! I looked at the Viz and realised I couldn't easily find a specific road - so I've fixed that, and now you can! If you've ever been driving by another crash on your way to work and wondered how many crashes there've been, you can search for that road on this viz.
The other new filter is a sort of natural progression from that, in that you can filter by local authority. If you live in Glasgow City and want to see where road accidents have happened, you can do that too!
Also note, these filters update the table at the bottom - so you can get the same casualty detail by individual road and local authority. Iteration 3 will be coming in November.
No comments:
Post a Comment