
30 minutes to find some data, format it (if necessary), plug it in to Tableau, create a Viz and publish it. Think I did a reasonable job with this, admittedly limited, dataset. It would be fascinating to add in the data from 2011 (as far back as data goes), but that would have required downloading 30+ CSV files and merging them into one - eating up valuable viz time!
What'd be even more fascinating is to expand the dataset to include other councils from the Greater Manchester area and beyond.
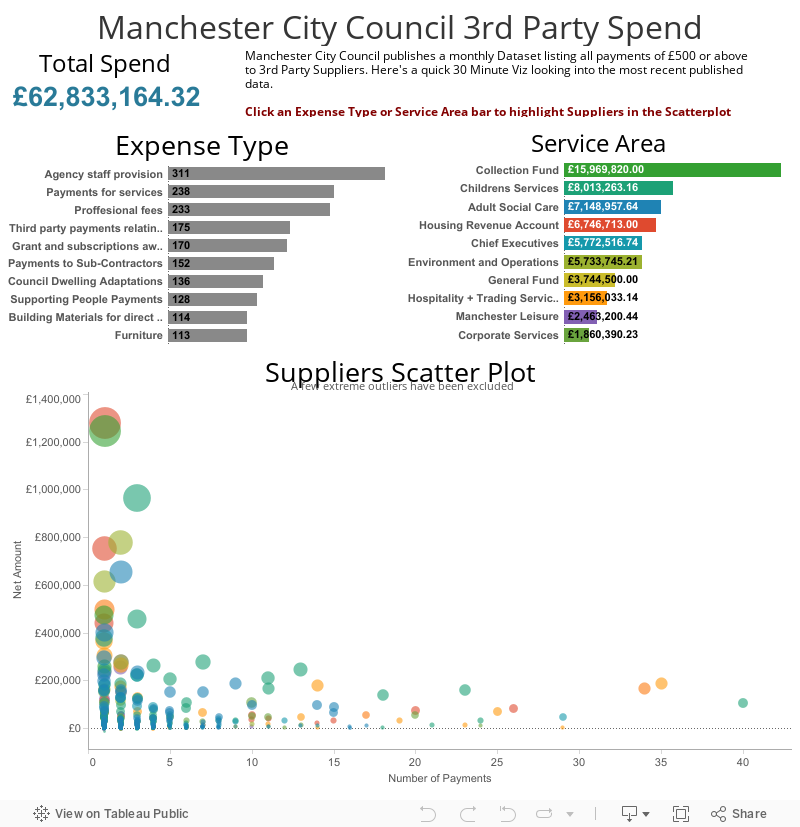
Consider this: Manchester City Council spends £62.8m on £500+ payments to 3rd Party Suppliers in this one month, that's probably about £730m per annum (assuming October to be an average month). That's just one council. There are 434 Councils in the UK.
One for next time maybe ;)
Final note: The Scatterplot does something a little interesting (that I never thought could be done). Hint - select one of the circles to see what happens!
Great work for 30 minutes. I find it interesting that your first comment was "I'd love to add x...." that's so often the way - one investigation leads to more questions and more data and then more insight: that's the Cycle of Visual Analysis, right there!
ReplyDeleteThanks Andy, looks ok for 30 minutes - took 8 minutes to find an interesting dataset
DeleteI think that's the beauty of Tableau. Very rarely do I see a viz and think that I have all the answers I could possibly ever want. It gives a platform for people to exercise their restless curiosity!