
Friday, 2 June 2017
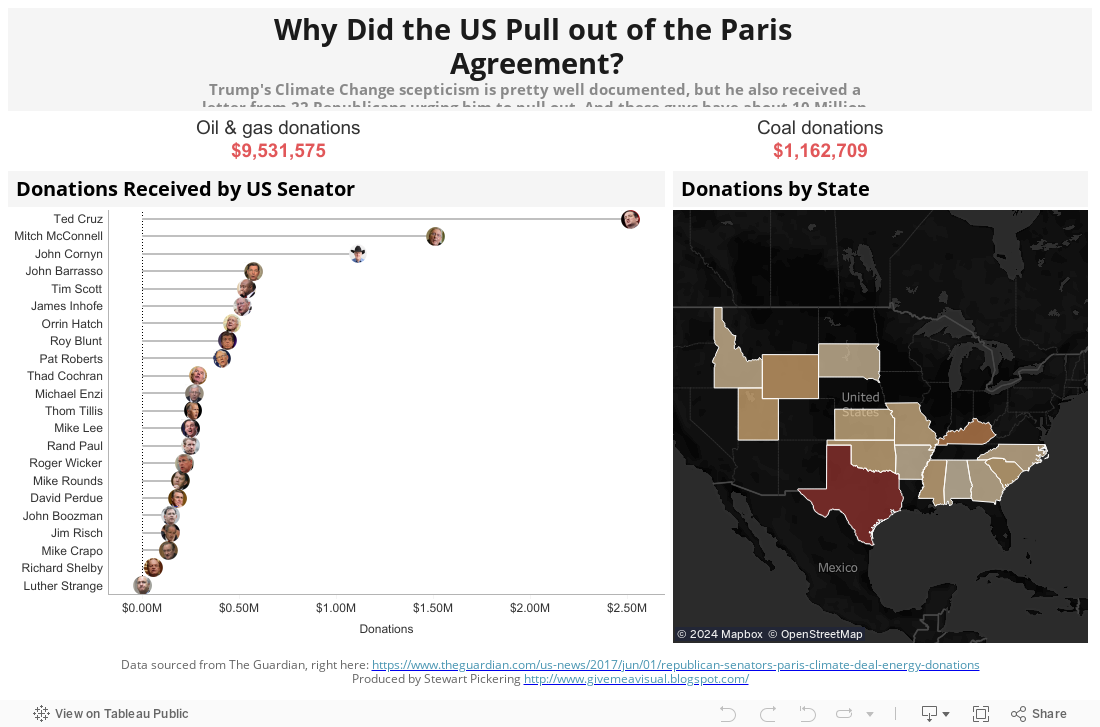
The Paris Agreement
As reported in The Guardian, 22 Republican Senators signed a letter addressed to Donald Trump urging him to pull out of the Paris Agreement. The Guardian also provided some numbers, so here’s a Viz looking at the 10 Million reasons why this may be of benefit to them…
Thursday, 31 March 2016
Magnificent Mahrez?
Central to Leicester City's rise from almost-certain relegation in the 2014/15 Premier League season, to almost-certain title winners in the 2015/16 Premier League season, has been Riyad Mahrez. Not only is that a shocking sentence to have composed, it's also shocking just how much impact Mahrez has actually had. With 16 goals and 11 assists in the league this season, he has been a revelation.
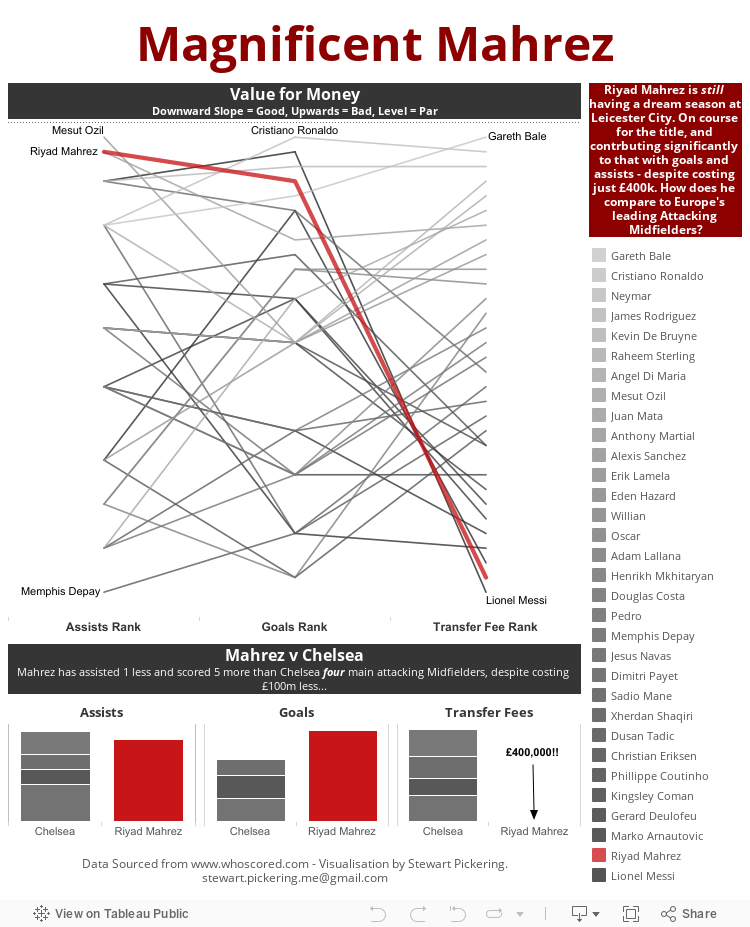
And just to continue with that 'shocking' theme, he was plucked from the relative obscurity of Le Havre in France's Ligue 2 for a mere £400,000. For that amount, you could probably buy Cristiano Ronaldo's big toe. I extracted some data from www.whoscored.com (sadly not about Ronaldo's toe), to see just how his contribution measured up to some of Europe's leading lights in the Attacking Midfield positions.
For this visualisation I've only looked at Assists and Goals, because there's a whole myriad of different ways to measure, I didn't want to get too bogged down in that just yet, despite how interesting it may be. One pick that I didn't bring through was that of the 32 players I selected, Mahrez ranks 26th for average passes per game. So despite seeing less of the ball than his contemporaries, he seems to do an awful lot more with it.
But I digress, and to the viz - I'll let you judge for yourself who it reflects well and badly upon...
Wednesday, 3 February 2016
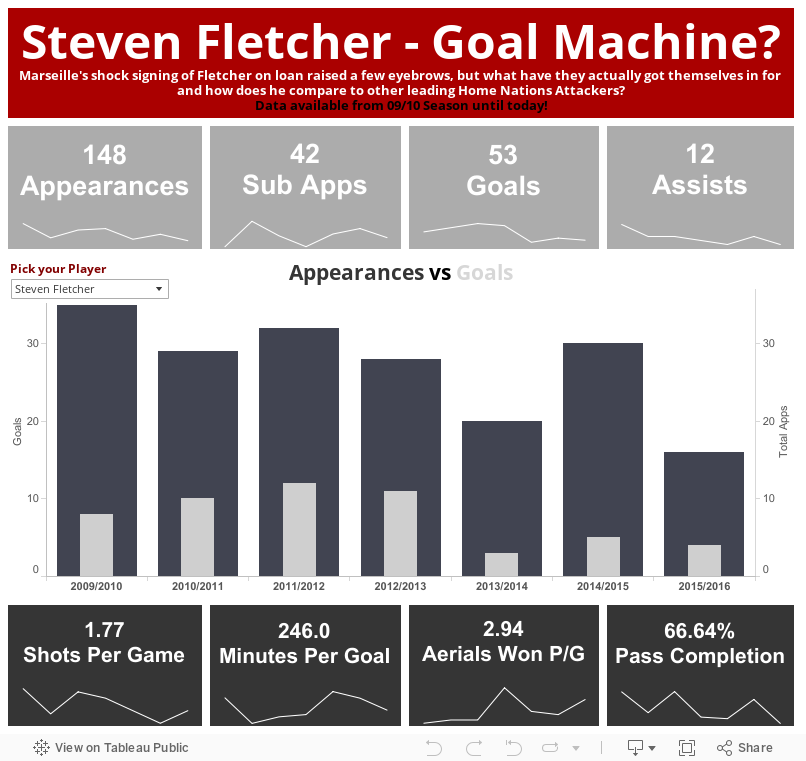
Steven Fletcher - Marseille's New Goal Machine?
You know it's been a boring transfer deadline day when the biggest shock is the completely left-field loan signing of Steven Fletcher. No offence to the guy, but amongst the other names touted for a move he doesn't exactly set the pulses racing.
There are a few reasons it has surprised me:
There are a few reasons it has surprised me:
- Marseille play with one striker, and he's unlikely to displace Michy Batshuaiyi from the starting line up, or play alongside him very often
- His biggest strength lies when the ball is in the air - so why have Sunderland, scrapping away at the bottom of the table let him go? You'd assume he could strike up a good partnership with Defoe, plucking the ball out of the air and feeding it in to the little man.
- He's a striker not renowned for his goalscoring prowess - 6 of his 8 international goals for Scotland have been scored against Gibraltar.
Anyway, I raided Whoscored.com for some stats and compared him to a couple of other attacking players from the Home Nations (England, Wales & Republic of Ireland) - I intended to inlcude Northern Ireland, but their main striker plays only slightly more top flight football than I do, thus rendering any comparion completely pointless (as opposed to only slightly pointless for the rest).
Fletcher doesn't really fit in with Marseille's current style of play, so I think their thought process in signing him is to lump the ball into the box late on in matches where they're drawing or losing. It's a ploy that could well work.
Fletcher doesn't really fit in with Marseille's current style of play, so I think their thought process in signing him is to lump the ball into the box late on in matches where they're drawing or losing. It's a ploy that could well work.
The visual gives you an overview of a few keys stats from the past 6 seasons, and lets you choose which player to look at. There are sparklines beneath each stat, so you can view the trend in each area:
Wednesday, 20 January 2016
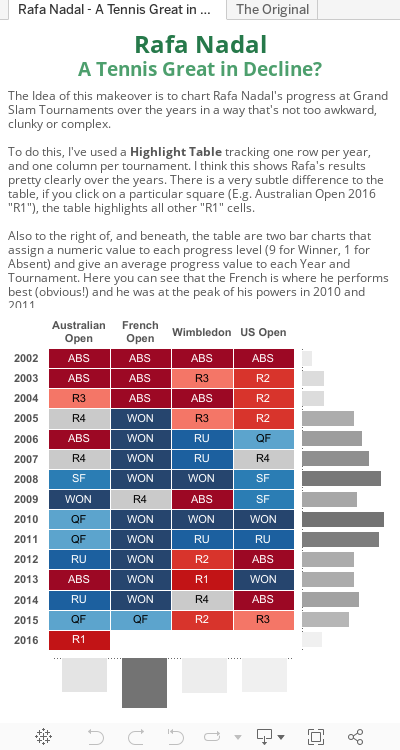
Midweek Makeover
So, I saw a visualisation on the BBC Sport website, looking at Rafa Nadal's Grand Slam career performance after his first round knock-out at the hands of Fernando Verdasco. Looking at it, it's fairly straightforward to read, but it just doesn't look right - it felt as though they'd used the wrong type of chart to visualise this data. So I thought I'd attempt to make it over, see if I could do any better. Judge for yourself!
Thursday, 14 January 2016
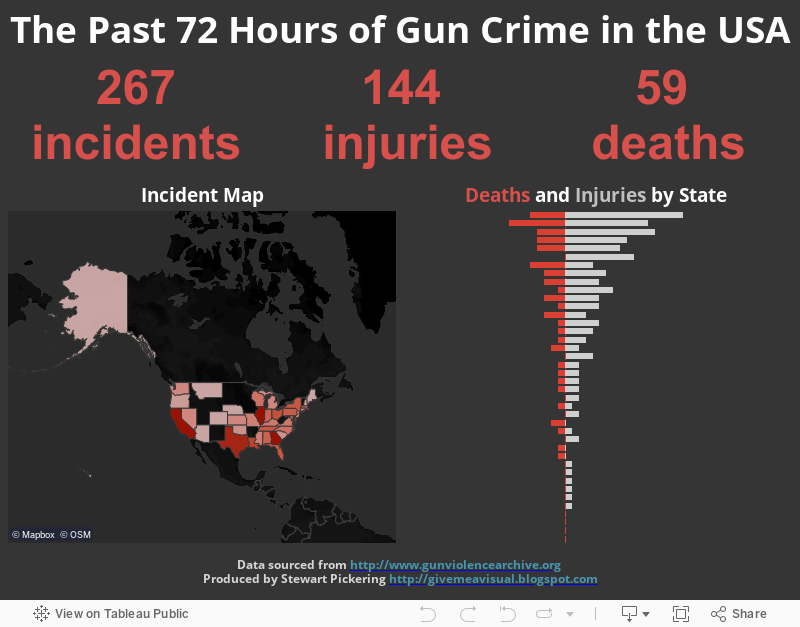
Gun Crime in The USA - Just the last 72 Hours
So, I'd heard a few stats about the number of gun-related deaths in the US since the turn of the year and thought I'd look for some data on that. What I actually found only covers the last 72 hours, but is still quite staggering (to me at least, in the UK):
Monday, 11 January 2016
Can Money Buy You Love in the Top 5 Leagues in Europe?
First and foremost, welcome to 2016 - I hope you all have a prosperous, fun and exciting new year! 2015 was a great year for me, escaping an employer that was seemingly content to stop investing in staff development, into a new role with a new employer where the entire culture is focused on development. A refreshing change, but enough about me - let's talk data.
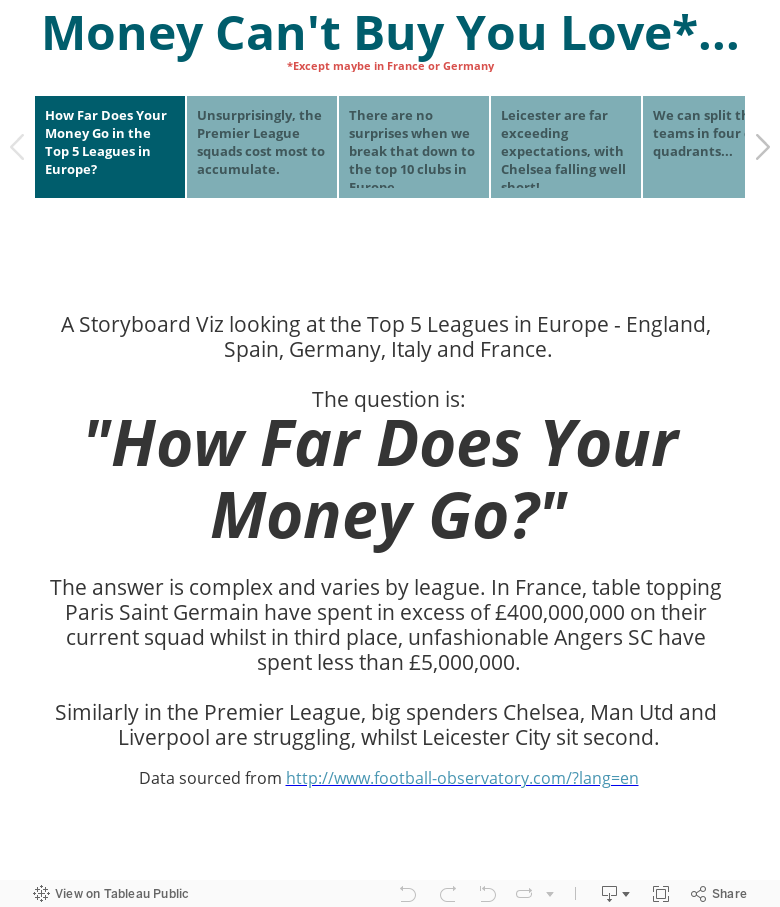
The data for this post comes from the Football Observatory in Switzerland, and the idea came about after I saw them featured in the Independant, looking at the top 100 valuable players in Europe. I delved around on their site and found data that had tracked the transfer fees spent on current squads for all teams in the top 5 leagues in Europe.
Naturally I wondered how those transfer fees had translated into points and league positions. The results of that curiosity can be found in the storyboard visualisation below. A couple of great finds came out of it:
- Obviously Leicester are tearing up trees in the Premier League, but across the Channel, Angers and Caen are moving mountains on their shoestring budgets. So small has their transfer outlay been, the Football Observatory rounded it up to 'Less than 5 million Euros'. So the actual numbers are probably less than displayed.
- Also Chelsea have been at the centre of attention for failing so miserably this season, but don't let that detract from Newcastle, Sunderland and Aston Villa. Their poor seasons have not gone unnoticed but perhaps the cost of their squads has at £123m, £102m and £98m they are ranked 19th, 25th and 26th in Europe respectively on that score. Pretty shocking!
Tuesday, 3 November 2015
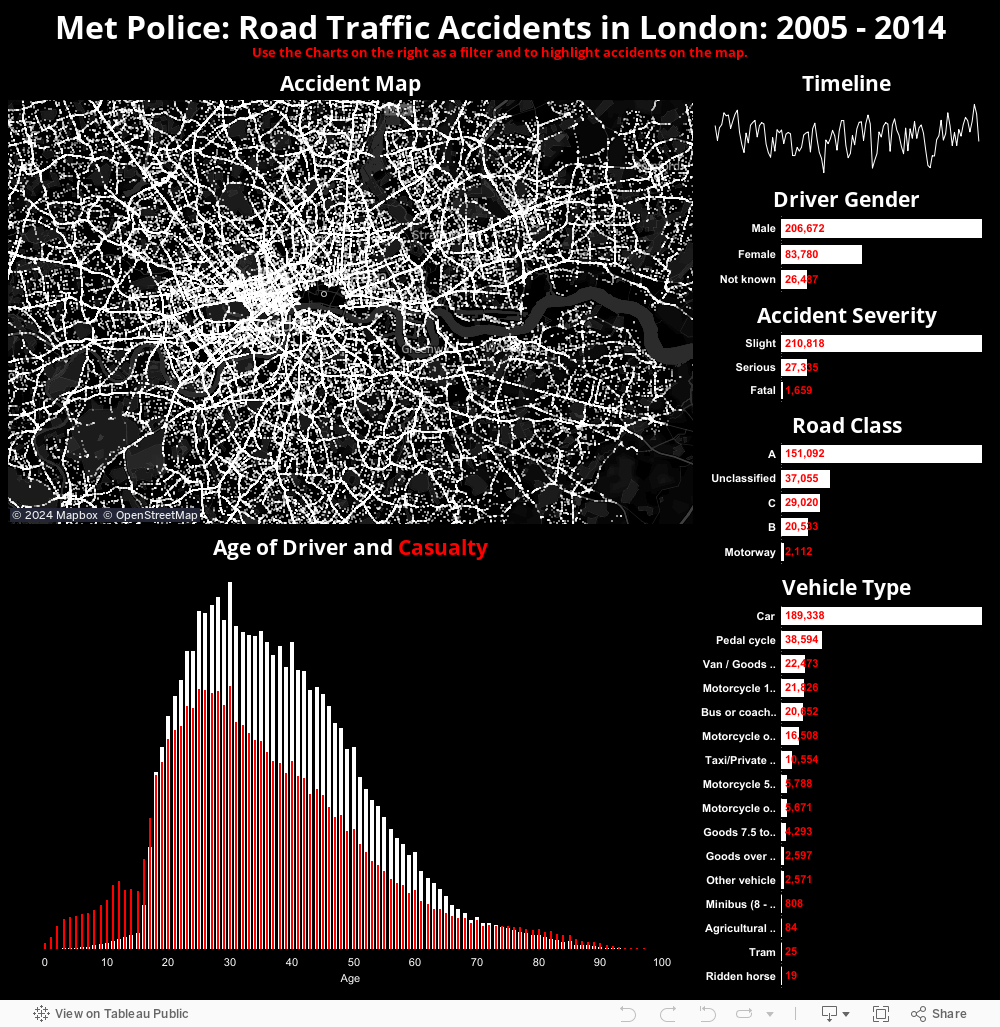
Road Traffic Accidents: London 2005 - 2014
I think this will probably be my last viz for a while using this particular set of data. It's an incredibly useful dataset for honing your Tableau skills so I'd certainly recommend it. Downloaded from data.gov.uk and processed using Alteryx to join three datasets together (Accidents, Casualties and Vehicles) you get about 5 million rows and an awful lot of map points.
For that reason you really need to filter it down to stop everything grinding to a halt (though this sounds like a future challenge potentially). So, I took the most instantly recognisable city in Europe, maybe the world, and plotted all RTAs within the Metropolitan Police jurisdiction. Note City of London is empty. I assure you, cars can crash there, it's just they have their own separate police force.
Anyway, to the viz!
Subscribe to:
Comments (Atom)