Showing posts with label Premier League. Show all posts

Thursday, 31 March 2016

Magnificent Mahrez?

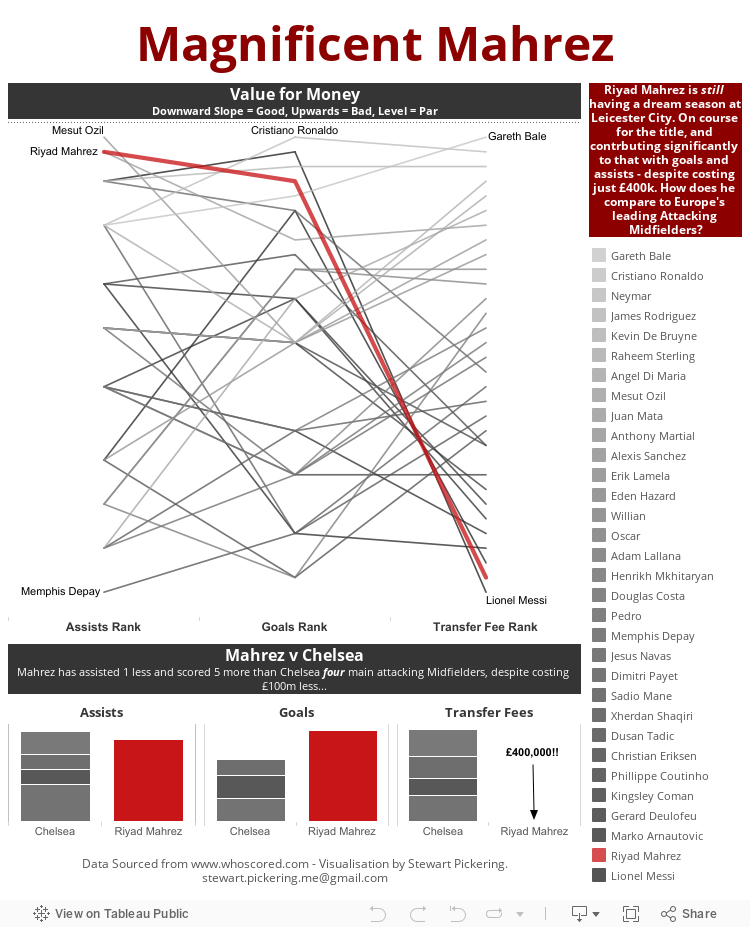
Central to Leicester City's rise from almost-certain relegation in the 2014/15 Premier League season, to almost-certain title winners in the 2015/16 Premier League season, has been Riyad Mahrez. Not only is that a shocking sentence to have composed, it's also shocking just how much impact Mahrez has actually had. With 16 goals and 11 assists in the league this season, he has been a revelation.

And just to continue with that 'shocking' theme, he was plucked from the relative obscurity of Le Havre in France's Ligue 2 for a mere £400,000. For that amount, you could probably buy Cristiano Ronaldo's big toe. I extracted some data from www.whoscored.com (sadly not about Ronaldo's toe), to see just how his contribution measured up to some of Europe's leading lights in the Attacking Midfield positions.

For this visualisation I've only looked at Assists and Goals, because there's a whole myriad of different ways to measure, I didn't want to get too bogged down in that just yet, despite how interesting it may be. One pick that I didn't bring through was that of the 32 players I selected, Mahrez ranks 26th for average passes per game. So despite seeing less of the ball than his contemporaries, he seems to do an awful lot more with it.

But I digress, and to the viz - I'll let you judge for yourself who it reflects well and badly upon...


Wednesday, 26 August 2015

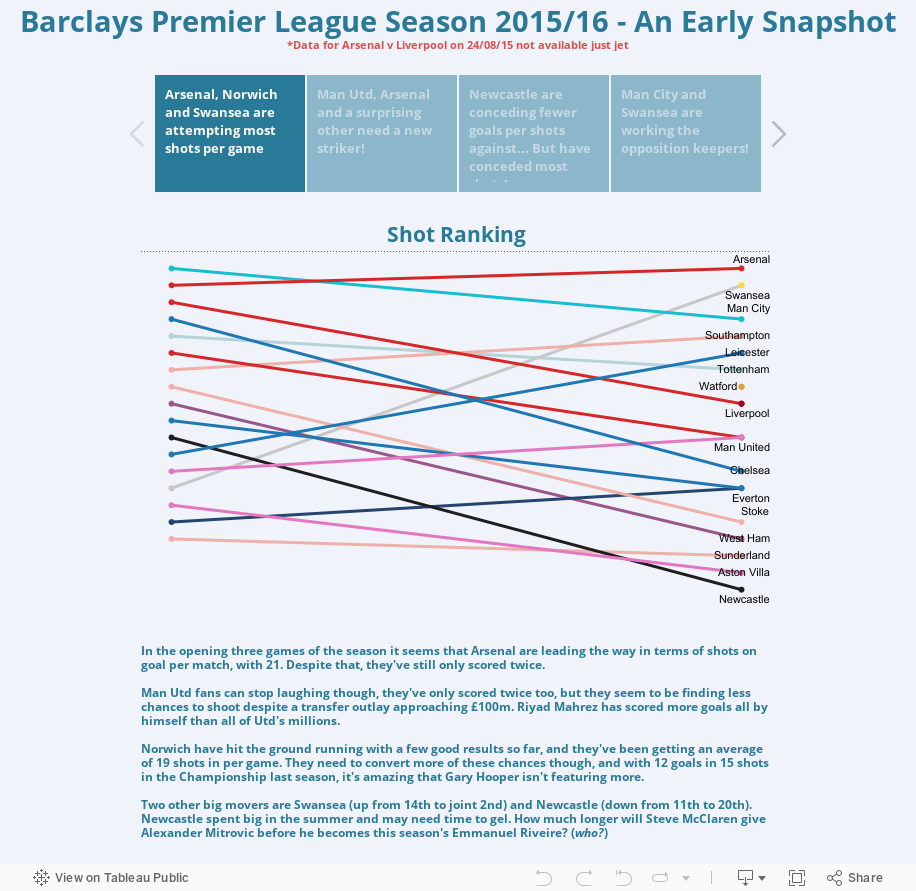
Shooting for the Stars (But Missing Quite Often)

You may have noticed that this has become a bit of a Football stats blog of late, but with the new season just three games old, a whole plethora of data available and some new toys to play with, I think it'd be rude not to!

The latest dataset comes courtesy of www.football-data.co.uk, it's a relatively straightforward set of data containing standard high level data on matches played so far this season. The format it's in doesn't really lend itself to much analysis though, so my favourite new toy - Alteryx - helps me prep the data in ridiculously quick time.

The raw data gives one row per match, dividing the team data into 'Home' and 'Away'. So if I want to aggregate all data relating to Chelsea, it becomes a bit difficult, as they essential have two fields for each statistic, as well as two fields for their actual name. Using Alteryx I split out the 'Home' and 'Away' team data, cleaned it up, renamed the headers to match and used the Union tool to append the 'Away' data to to the end of the 'Home' data. The finished workflow is remarkably simple:


I'm bringing the data in, using the Record ID tool to assign each match a unique ID, using the Select tool to pick up the 'Home' fields only, and another for the 'Away' fields where they are renamed to match, then using the Union tool to put them back together again, using two Formula tools I'm adding a new field called 'Season' and with the second I'm setting up a field called Result and populating it before outputting the data. Easy.

All I needed to do now was import it into Tableau Public and see what I could find:


Thursday, 20 August 2015

My First Webscrape - Premier League Player Ratings 2014/15

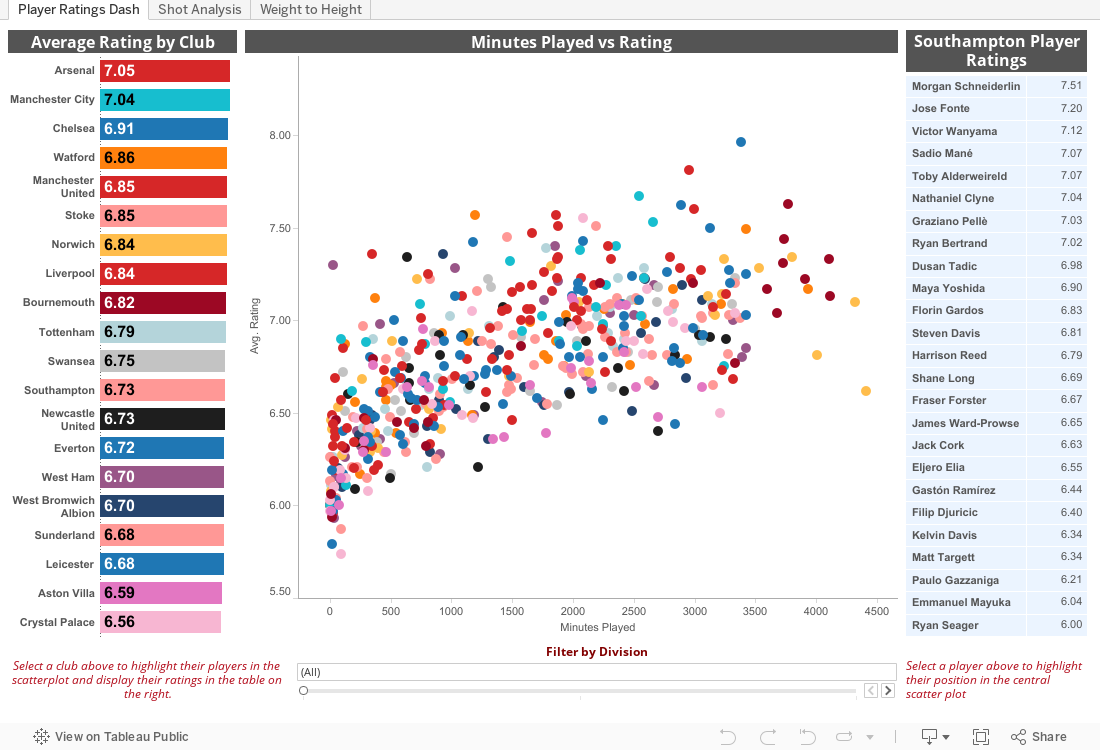
A couple of things led to the creation of this visualisation - a couple of colleagues and I are attempting to build models predicting the outcome of every Premier League match this season, with varying degrees of success, and secondly I saw Chris Love's awesome scrape of the BBC live text data. That got me thinking, if that complete mess of data can be scraped, anything can.

At first I tried to use the Alteryx Download and JSON Parse tools in a similar way to Carl at The Information Lab, but I'm a complete novice and couldn't get it to work. Definitely running before I can walk. But fortunately enough, I stumbled upon Data School student Hashu Shenkar's post on using Import.io in conjunction with Alteryx. I'd used Import.io before, but wasn't really aware just how powerful it could be - Hashu's post opened my eyes to what it could do.

I wanted to scrape Whoscored.com's Player Summary data, club-by-club for last season, for clubs who are currently in the Premier League (so we exclude QPR, Hull & the other one who got relegated) and include Norwich, Watford and Bournemouth's Championship stats (you can highlight and filter their data if you are against comparing apples with pears). I soon realised that WhoScored isn't the easiest to scrape from, but managed to get the Summary data, after about 8 attempts - for reasons unbeknown to me, when I published my API and ran my block list of 20 URLs through it, some would fail. I then had an issue where the API was skipping over players who were transferred out, such as Christian Benteke.

Anyway, data all downloaded I put it into Alteryx to clean it up, get rid of repeated fields, weird characters and organise it ready for Tableau. I'm currently evaluating Alteryx for a couple of weeks so I thought what better way to ease myself into it? The raw data scraped using Importio included Player Position data (as you'll see in the viz) in this kind of format: AM(RLC), FW. So I created a workflow in Alteryx to break that down into Individual positions: AMR, AML, AMC and FW with one row per player per position.

Once that was done, I had two csv files ready for Tableau Public!

Within this data there's a lot of insight to be gained, all sorts of interesting little stats hidden away and patterns emerge pretty quickly. I particularly enjoy how Chelsea's players are split in to two clusters, rating-wise, probably the only team aside from AFC Bournemouth, who have a clearly defined starting 11 with minimal rotation. That served them well last season, but with the increased competition in the PL and the step up for Bournemouth, is it unrealistic to expect that same approach to work for both teams this season? No doubt we'll find out.

One final point, WhoScored also have separate tabs (Javascript I believe) for offensive, defensive and passing statistics, but try as I may, I couldn't get import.io to scrape from those - any tips on how to do that would be most welcome. Enjoy the viz, was great fun making it from start to finish.

As usual, everything is interactive so click away and see what you can find. On the second tab, I've picked out some stats that caught my attention.