

Tuesday, 27 October 2015
Road Traffic Accidents in London: 2005 - 2014
Was having a little play around with Alteryx and Tableau, giving a demo with Public Data and created this map of Road Traffic Accidents attended to by the Metropolitan Police. Thought this image was well worth a share.

Tuesday, 29 September 2015
Major Earthquakes of the 21st Century
It's been a couple of weeks since my last post, and I've decided to move away from Football, albeit temporarily, and back over to Wikipedia based data. We all know there's a wealth of information there, but there's also a wealth of Data contained within their pages too. This example looks at Major Earthquakes of the 21st Century, though I'm thinking I might expand that out later to cover the 20th Century too.
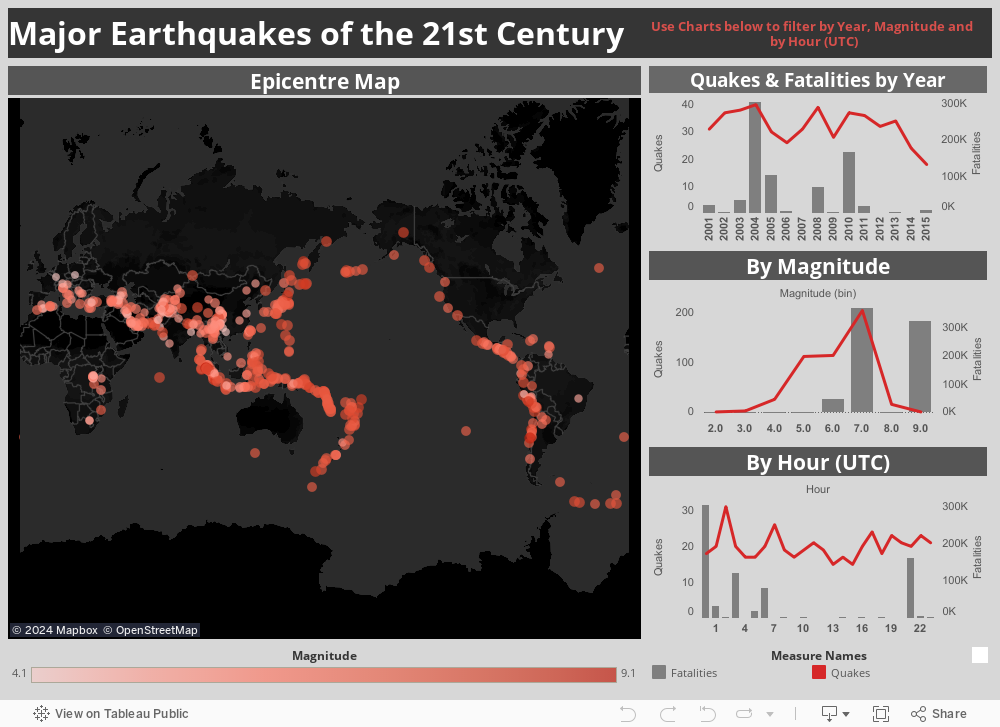
The visual is of course fully interactive, and I think it actually looks pretty smart and uncluttered. All feedback is welcome of course.
Data originally found here:
Wednesday, 26 August 2015
Shooting for the Stars (But Missing Quite Often)
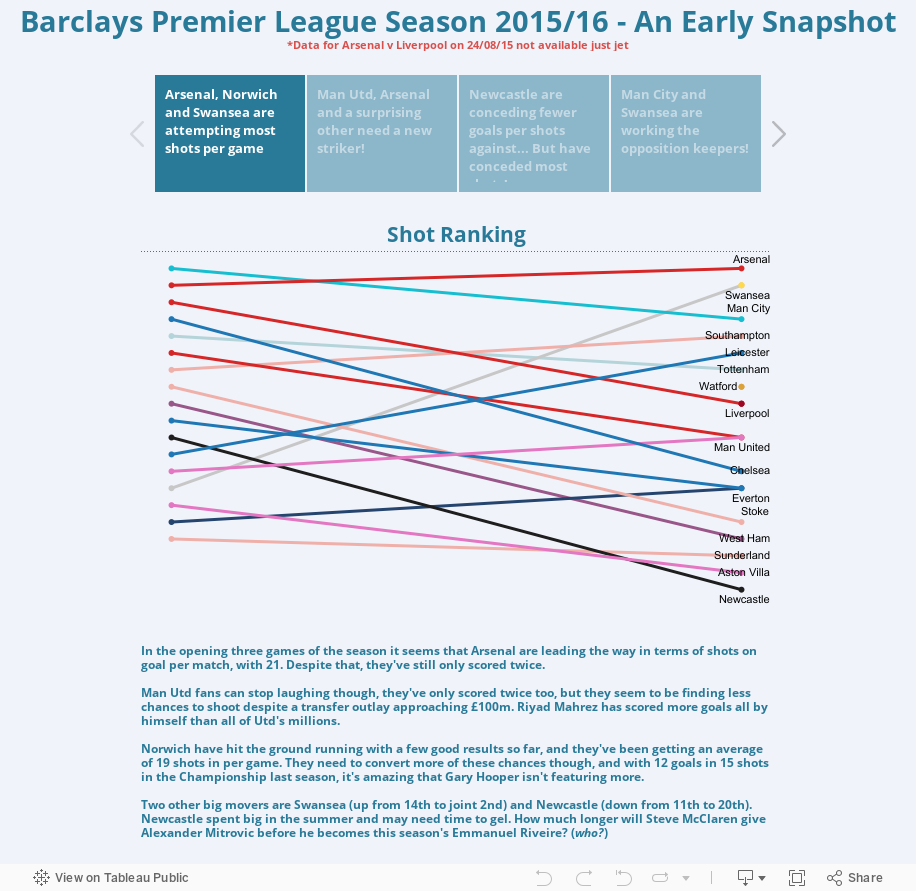
You may have noticed that this has become a bit of a Football stats blog of late, but with the new season just three games old, a whole plethora of data available and some new toys to play with, I think it'd be rude not to!
The latest dataset comes courtesy of www.football-data.co.uk, it's a relatively straightforward set of data containing standard high level data on matches played so far this season. The format it's in doesn't really lend itself to much analysis though, so my favourite new toy - Alteryx - helps me prep the data in ridiculously quick time.
The raw data gives one row per match, dividing the team data into 'Home' and 'Away'. So if I want to aggregate all data relating to Chelsea, it becomes a bit difficult, as they essential have two fields for each statistic, as well as two fields for their actual name. Using Alteryx I split out the 'Home' and 'Away' team data, cleaned it up, renamed the headers to match and used the Union tool to append the 'Away' data to to the end of the 'Home' data. The finished workflow is remarkably simple:

I'm bringing the data in, using the Record ID tool to assign each match a unique ID, using the Select tool to pick up the 'Home' fields only, and another for the 'Away' fields where they are renamed to match, then using the Union tool to put them back together again, using two Formula tools I'm adding a new field called 'Season' and with the second I'm setting up a field called Result and populating it before outputting the data. Easy.
All I needed to do now was import it into Tableau Public and see what I could find:
The latest dataset comes courtesy of www.football-data.co.uk, it's a relatively straightforward set of data containing standard high level data on matches played so far this season. The format it's in doesn't really lend itself to much analysis though, so my favourite new toy - Alteryx - helps me prep the data in ridiculously quick time.
The raw data gives one row per match, dividing the team data into 'Home' and 'Away'. So if I want to aggregate all data relating to Chelsea, it becomes a bit difficult, as they essential have two fields for each statistic, as well as two fields for their actual name. Using Alteryx I split out the 'Home' and 'Away' team data, cleaned it up, renamed the headers to match and used the Union tool to append the 'Away' data to to the end of the 'Home' data. The finished workflow is remarkably simple:

I'm bringing the data in, using the Record ID tool to assign each match a unique ID, using the Select tool to pick up the 'Home' fields only, and another for the 'Away' fields where they are renamed to match, then using the Union tool to put them back together again, using two Formula tools I'm adding a new field called 'Season' and with the second I'm setting up a field called Result and populating it before outputting the data. Easy.
All I needed to do now was import it into Tableau Public and see what I could find:
Thursday, 20 August 2015
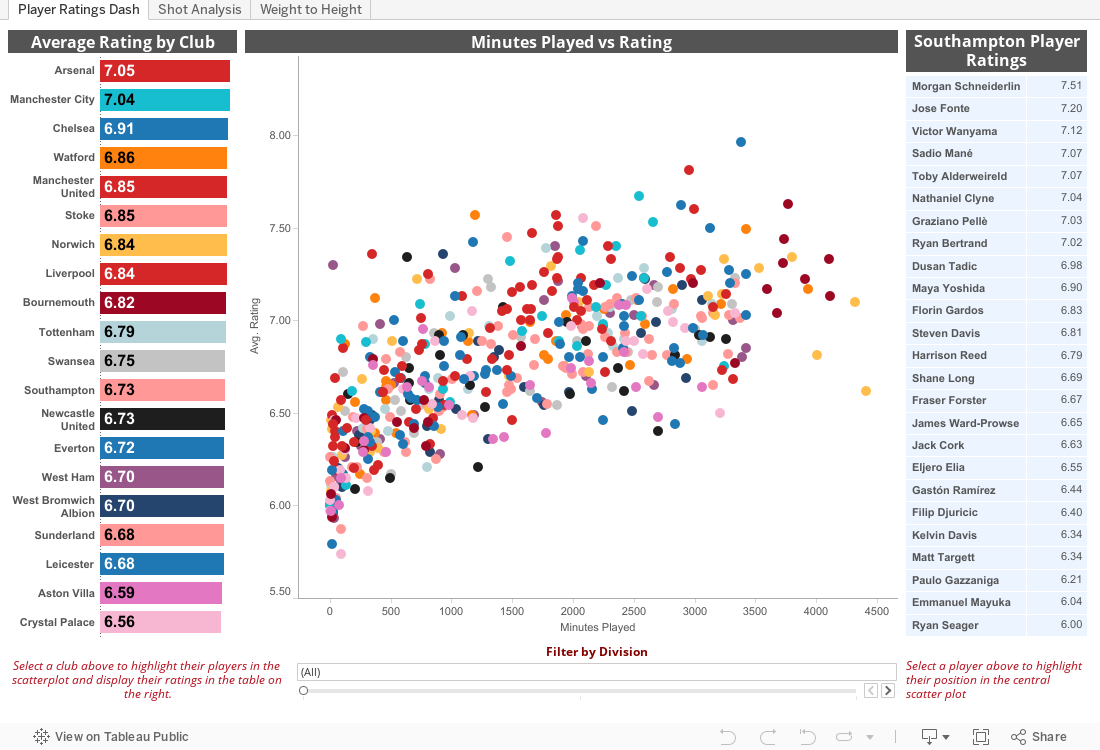
My First Webscrape - Premier League Player Ratings 2014/15
A couple of things led to the creation of this visualisation - a couple of colleagues and I are attempting to build models predicting the outcome of every Premier League match this season, with varying degrees of success, and secondly I saw Chris Love's awesome scrape of the BBC live text data. That got me thinking, if that complete mess of data can be scraped, anything can.
At first I tried to use the Alteryx Download and JSON Parse tools in a similar way to Carl at The Information Lab, but I'm a complete novice and couldn't get it to work. Definitely running before I can walk. But fortunately enough, I stumbled upon Data School student Hashu Shenkar's post on using Import.io in conjunction with Alteryx. I'd used Import.io before, but wasn't really aware just how powerful it could be - Hashu's post opened my eyes to what it could do.
I wanted to scrape Whoscored.com's Player Summary data, club-by-club for last season, for clubs who are currently in the Premier League (so we exclude QPR, Hull & the other one who got relegated) and include Norwich, Watford and Bournemouth's Championship stats (you can highlight and filter their data if you are against comparing apples with pears). I soon realised that WhoScored isn't the easiest to scrape from, but managed to get the Summary data, after about 8 attempts - for reasons unbeknown to me, when I published my API and ran my block list of 20 URLs through it, some would fail. I then had an issue where the API was skipping over players who were transferred out, such as Christian Benteke.
Anyway, data all downloaded I put it into Alteryx to clean it up, get rid of repeated fields, weird characters and organise it ready for Tableau. I'm currently evaluating Alteryx for a couple of weeks so I thought what better way to ease myself into it? The raw data scraped using Importio included Player Position data (as you'll see in the viz) in this kind of format: AM(RLC), FW. So I created a workflow in Alteryx to break that down into Individual positions: AMR, AML, AMC and FW with one row per player per position.
Once that was done, I had two csv files ready for Tableau Public!
Within this data there's a lot of insight to be gained, all sorts of interesting little stats hidden away and patterns emerge pretty quickly. I particularly enjoy how Chelsea's players are split in to two clusters, rating-wise, probably the only team aside from AFC Bournemouth, who have a clearly defined starting 11 with minimal rotation. That served them well last season, but with the increased competition in the PL and the step up for Bournemouth, is it unrealistic to expect that same approach to work for both teams this season? No doubt we'll find out.
One final point, WhoScored also have separate tabs (Javascript I believe) for offensive, defensive and passing statistics, but try as I may, I couldn't get import.io to scrape from those - any tips on how to do that would be most welcome. Enjoy the viz, was great fun making it from start to finish.
As usual, everything is interactive so click away and see what you can find. On the second tab, I've picked out some stats that caught my attention.
At first I tried to use the Alteryx Download and JSON Parse tools in a similar way to Carl at The Information Lab, but I'm a complete novice and couldn't get it to work. Definitely running before I can walk. But fortunately enough, I stumbled upon Data School student Hashu Shenkar's post on using Import.io in conjunction with Alteryx. I'd used Import.io before, but wasn't really aware just how powerful it could be - Hashu's post opened my eyes to what it could do.
I wanted to scrape Whoscored.com's Player Summary data, club-by-club for last season, for clubs who are currently in the Premier League (so we exclude QPR, Hull & the other one who got relegated) and include Norwich, Watford and Bournemouth's Championship stats (you can highlight and filter their data if you are against comparing apples with pears). I soon realised that WhoScored isn't the easiest to scrape from, but managed to get the Summary data, after about 8 attempts - for reasons unbeknown to me, when I published my API and ran my block list of 20 URLs through it, some would fail. I then had an issue where the API was skipping over players who were transferred out, such as Christian Benteke.
Anyway, data all downloaded I put it into Alteryx to clean it up, get rid of repeated fields, weird characters and organise it ready for Tableau. I'm currently evaluating Alteryx for a couple of weeks so I thought what better way to ease myself into it? The raw data scraped using Importio included Player Position data (as you'll see in the viz) in this kind of format: AM(RLC), FW. So I created a workflow in Alteryx to break that down into Individual positions: AMR, AML, AMC and FW with one row per player per position.
Once that was done, I had two csv files ready for Tableau Public!
Within this data there's a lot of insight to be gained, all sorts of interesting little stats hidden away and patterns emerge pretty quickly. I particularly enjoy how Chelsea's players are split in to two clusters, rating-wise, probably the only team aside from AFC Bournemouth, who have a clearly defined starting 11 with minimal rotation. That served them well last season, but with the increased competition in the PL and the step up for Bournemouth, is it unrealistic to expect that same approach to work for both teams this season? No doubt we'll find out.
One final point, WhoScored also have separate tabs (Javascript I believe) for offensive, defensive and passing statistics, but try as I may, I couldn't get import.io to scrape from those - any tips on how to do that would be most welcome. Enjoy the viz, was great fun making it from start to finish.
As usual, everything is interactive so click away and see what you can find. On the second tab, I've picked out some stats that caught my attention.
Tuesday, 4 August 2015
Barclays Premier League Stats - Chelsea Deserved the Title Last Season
With the new Barclays Premier League just around the corner, a few people at my workplace have challenged ourselves to build and develop a model to predict Premier League scores and results each weekend. The models are allowed to change as often as we like, the only rule as such is we are not allowed to use 'Gut Feel' - only data. It should be an interesting challenge for us, and one that hopefully will see us learn some new data geekery over the course of 9 months.
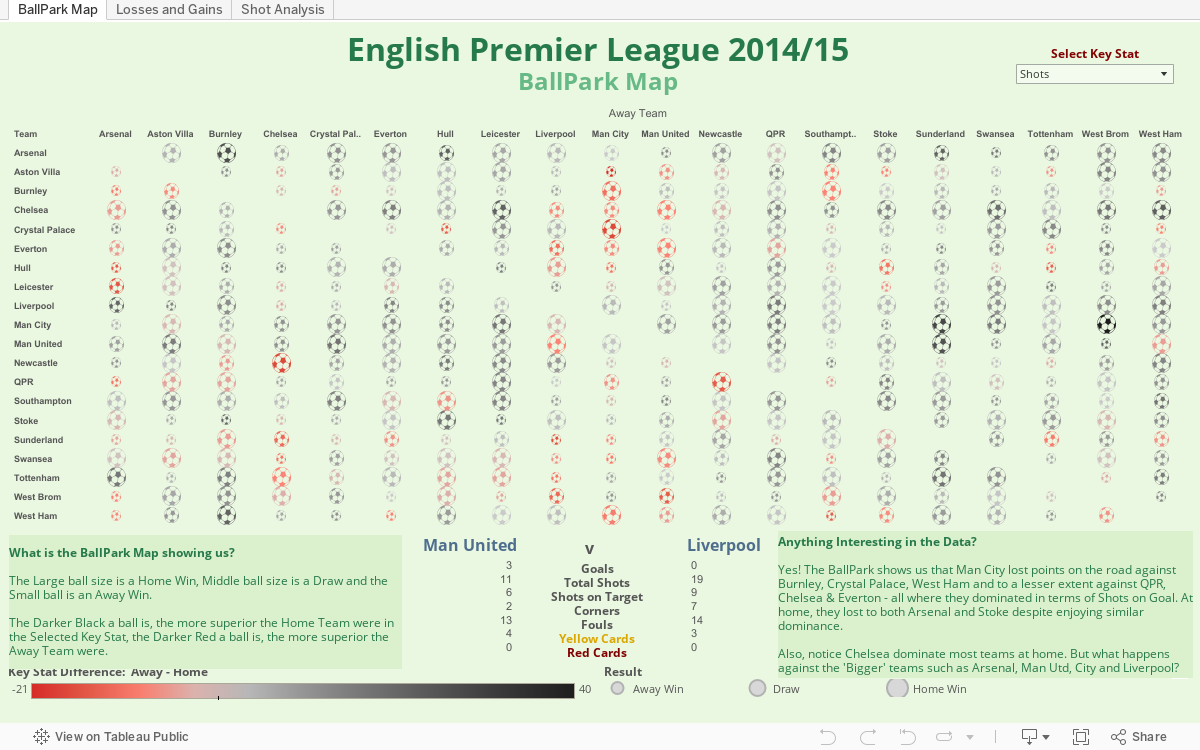
So naturally we found some pretty interesting datasets on our quests to build our models, not least from football-data.co.uk, which I have made an attempt to visualise below. It's obviously not in Tableau-friendly format, so I've had to rework it a bit. There were some really interesting insights within the data, that should lead some EPL fans to worry about their team's prospects.
The name of the game is to score lots and concede few, something that Chelsea seemed to get down to an art form, grinding out boring victories towards the latter end of the season, it's fascinating to see the data reflecting that.
My favourite stat hidden in the data is this: 1 in every 7 shots against Newcastle is a goal, whilst 1 in every 13 against Chelsea is a goal.
Here's the visual, enjoy!
So naturally we found some pretty interesting datasets on our quests to build our models, not least from football-data.co.uk, which I have made an attempt to visualise below. It's obviously not in Tableau-friendly format, so I've had to rework it a bit. There were some really interesting insights within the data, that should lead some EPL fans to worry about their team's prospects.
The name of the game is to score lots and concede few, something that Chelsea seemed to get down to an art form, grinding out boring victories towards the latter end of the season, it's fascinating to see the data reflecting that.
My favourite stat hidden in the data is this: 1 in every 7 shots against Newcastle is a goal, whilst 1 in every 13 against Chelsea is a goal.
Here's the visual, enjoy!
Friday, 24 July 2015
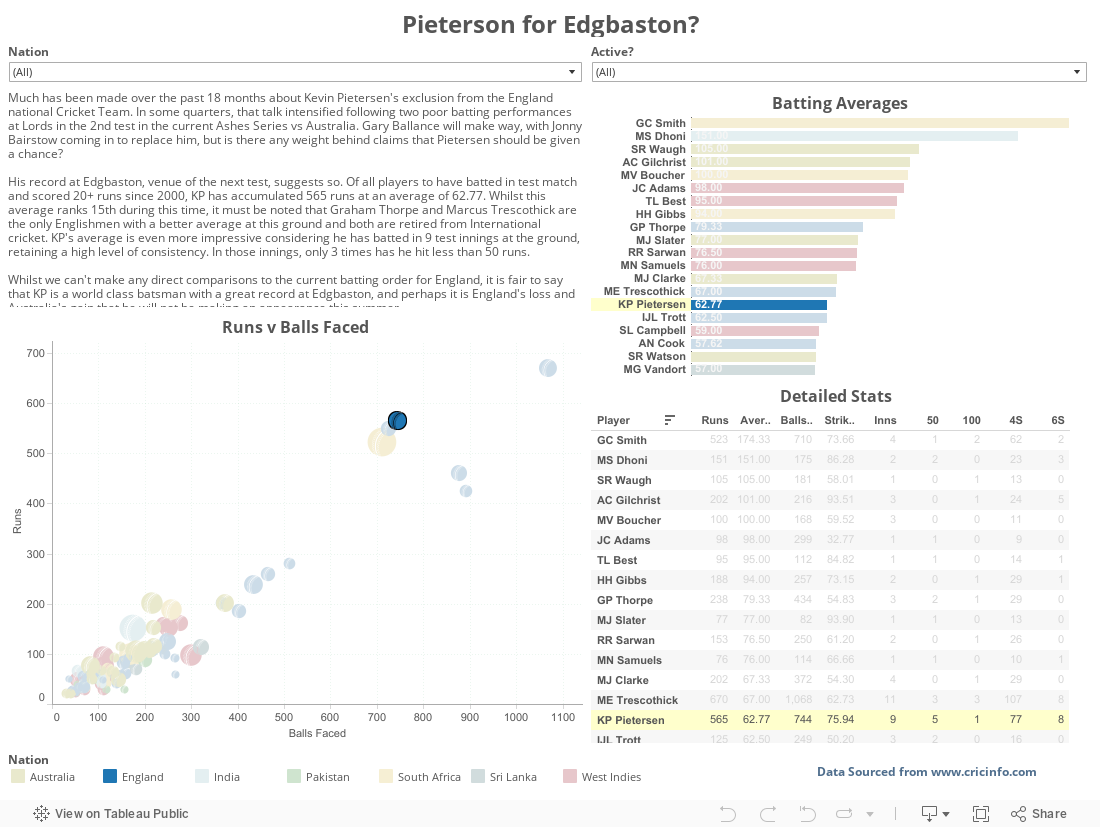
Pietersen for England?
The stats for Edgbaston over the past 15 years say that Kevin Pietersen should probably be playing against Australia in 5 days time. They also say that Alistair Cook and Ian Bell have decent records there too, and that Graham Smith was something of a phenomenon in the Black Country.
Thursday, 16 July 2015
Unfinished Viz-ness: The Gender Pay Gap
It has been a little while since my last foray into Tableau Public, April to be a little more specific, and I've actually changed jobs in that time. My new role has been quite a steep learning curve, so initially there wasn't really a great deal of time for Tableau - that's changing now, so expect a few more posts over the summer months.
I'll also be looking to start recording some of those nifty videos I've seen a few Tableau experts producing over the past year or so, offering my own tips and guidance for getting the most out of Tableau
In the meantime though, here is a topical viz looking at Gender Pay inequality across OECD nations. As is hinted at in the title, it's not fully complete - there is quite a bit of data to digest over on the OECD website, so I'm trying to digest it bit by bit and filter out some of the less interesting stuff. So far I've looked at Pay Gap Differences and 'Employed in Managerial Position' differences.
As always feel free to comment and make suggestions.

I'll also be looking to start recording some of those nifty videos I've seen a few Tableau experts producing over the past year or so, offering my own tips and guidance for getting the most out of Tableau
In the meantime though, here is a topical viz looking at Gender Pay inequality across OECD nations. As is hinted at in the title, it's not fully complete - there is quite a bit of data to digest over on the OECD website, so I'm trying to digest it bit by bit and filter out some of the less interesting stuff. So far I've looked at Pay Gap Differences and 'Employed in Managerial Position' differences.
As always feel free to comment and make suggestions.
Subscribe to:
Posts (Atom)